Today I will update a posting of a dozen years ago, entitled:Leading wind energy countries: (in MW, with second column representing % of electricity generated for country)
WHAT IS THE STATE OF WIND ENERGY TODAY?
In that blog of 5 August 2011 I said:
- In 2010 almost 40,000 MW of new wind energy conversion systems (WECS) became operational, an equivalent of 47 nuclear power plants (850 MW/reactor). The world total now is at around 200,000 MW of WECS, or said to be the equivalent of 235 nuclear facilities.
- There are 442 nuclear power plants in 30 countries having a net electricity capacity of 375,000 MW, with 63,000 MW in 16 countries under construction. However, almost half the new nuclear construction projects are in China, which has murmured the possibility of reviewing this option. Germany will shut down all its nuclear plants by 2022 and Japan is in a real dilemma.
- So I will first see how nuclear power has changed during these dozen years.
- Countries with nuclear power today = 32, or two more
- Number of power plants = 438, or four less
- Total capacity in megawatts electricity = 393,333, or 18,333 MW more.
- A typical nuclear facility is 1000 MW: they say that a plant this size uses 360 times less land than wind energy and 75 times less than a solar photovoltaic farm.
- Germany has decided to delay phase-out of nuclear, but only for one year.
- Belgium has postponed phase-out for ten years.
- Switzerland will phase-out by 2034.
- Spain is on track to phase-out both nuclear and coal by 2035.
- Japan has 33 available reactors, of which 10 are operating today, and two more are in construction. Fukushima has seriously affected Japan's economy, a pain that will continue for decades.
- The USA has by far the most nuclear power plants, with 92, and 2 more in construction.
- France has 56, with one in construction.
- China has 55, with 18 in construction.
- Russia has 37, with 4 in construction.
- South Korea has 25, with 3 in construction.
- Ukraine has 15, with 2 in construction.
- India has 22 with 8 in construction.
- Here is a list of nuclear powerplant accidents.
- USA has had 55 recorded accidents.
- The World? Count them.
- In short, nuclear power production is increasing.
- In 2010 Vestas Wind Energy Systems of Denmark sold 5,842 MW worth of wind turbines. For 2022, Vestas took 11,189 MW of orders.
- The largest companies are:
- #1 Vestas
- Has installed over 145,000 MW of wind turbines in 85 countries. Note again, for comparison purposes, that is like wind energy has replaced 145 nuclear powerplants.
- Largest onshore is 6.8 MW.
- Largest offshore has a rated power of 15 MW.
- #2 Siemens Gamesa (Spain)
- Subsidiary of Siemens Energy of Germany.
- Has installed 109,600 MW, 15,000 MW offshore.
- #3 Beijing Goldwind Science and Creation Windpower Equipment Company of China.
- Largest onshore wind turbine has a rated power of 8 MW.
- #4 Nordex of Germany.
- Largest onshore wind turbine is rated at 6 MW.
- #5 General Electric Renewable Energy of France, which is the green energy branch of General Electric.
- Has installed over 49,000 wind turbines.
- Their Halilade-X offshore turbine is rated at 14 MW.
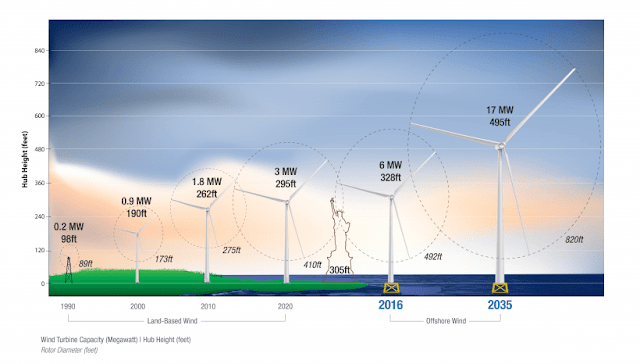
Size of wind turbines continues to grow. The Vestas V236-15MW is the largest today, with blades covering a diameter of 379 feet, longer than a football field, and stands 919 feet high. Depends on the available wind speed, of course, but Vestas says that this one machine can power 20,000 European households, saving more than 418,999 tons of carbon dioxide/year. Future offshore turbines will have a hub height (ground to middle of the turbine rotor) of 500 feet, about as high as the Washington Monument.
- #1 China 328,973 6.1%
- #2 USA 132,738 9.2%
- #3 Germany 63,760 23.1%
- Spain is #5, and at 19%, while the UK is #6 at 21%.
Eight years ago the USA was #1 in wind energy. China flew past us. Here are where these machines are in the U.S. Who knew in my early days that the middle portion of the nation had the highest average wind speed? 10 meters/second is 22.4 miles/hour. The rule of thumb is that you need at least 14 MPH (6.3 m/sec) to be in a favorable wind regime.
Here is another wind generation potential map. Note that there are few choice (blue and red) regions in the middle of the country. Something seems askew between the above and below maps. Only the ocean shows this very high potential. But building wind devices at sea is more expensive to install and maintain.
The best wind regimes in Hawaii are clearly between the islands because the volcanoes channel the winds there. The ENERGY produced by a wind turbine is the cube of the WIND SPEED. In other words, a 25 MPH site produces 8 (25/12.5 = 2....then 2x2x2 = 8) times more energy than a 12.5 MPH site. Thus, the future of wind energy in Hawaii will be in the Alenuihaha Channel between Maui and the Big Island, and also just south of South Point. However, all the channels are promising, for they have average wind speeds regions of 20 MPH and higher.
Electricity rates vary quite a bit across the country. This source says that in January of 2023, the electricity rate consumers pay in cents/kWh were:- San Diego 47.5
- Urban Hawaii 44.6 (I did not know we paid that much.)
- Boston 39.1
- San Francisco 31.7
- New York 24.3
- Urban Alaska 19.6
- Detroit 18.9
- Houston 18.1
- Tampa 17.7
- Phoenix 13.6
- Seattle 12.6
- St. Louis 12.2
Finally, how does wind energy generation costs compare with other options? Depends on who you ask. But the estimate from Lazard in 2021 showed, in cents/kWh:
- PV residential 14.7 to 22.1
- Nuclear 13.1 to 20.4
- Solar thermal 12.6-15.6
- Coal with carbon capture 6.5-15.2
- Wind offshore 8.3
- Geothermal 5.6-9.3
- Natural gas with carbon capture 4.5-7.4
- Wind onshore 2.6-5.0
There was no estimate for utility scale PV farms, but his figure has dropped quite a bit, and is comparable with wind onshore. Here is a composite table from Wikipedia, and you can see that these numbers are not exactly consistent.
Note the storage costs on the right. That is the problem with solar and wind. They come and go. Thus they both depend on the availability of storage options.
Here is another graphic of some meaning. The generation price from solar and wind has dramatically dropped, while that for nuclear has gone up.
-


Comments
Post a Comment